

Welcome to the 3rd part of my ultimate guide to describing charts and graphs. If you missed parts one and two, check out my guides to vocabulary for graphs and verb tenses for graphs. After learning about vocabulary and verb tenses for describing charts and graphs, there are just a few things we need to add before we can confidently and professionally describe charts and graphs in detail…
1. Putting the numbers in
Of course, if we want to give meaningful information about a graph or chart, we need to use some numbers. Here is a guide to the prepositions you need to use with the numbers from the graph.
[img_text_aside style=”2″ image=”http://fluencyspace.com/wordpress/wp-content/uploads/2019/03/Full-graph-2.jpg” image_alignment=”right” headline=”” alignment=”left”]
If you want to say how much profits have increased or decreased, we must use the preposition by.
Based on the graph on the right, we can say..:
‘In 2013, profits increased by 10 million dollars‘
‘Profits increased by 20%‘
[/img_text_aside]
We also use prepositions to and from to talk about figures on the graph: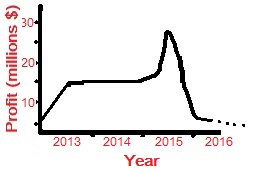
Based on the graph on the right, we can say..:
‘In 2013, profits increased to 15 million dollars‘
‘In 2015, profits fell from 30 million to 7 million dollars‘
With verbs like peaked / plateaued / levelled out / bottomed out we use the preposition at:
Again, based on the graph on the right we can say..:
‘In 2014, profits leveled off at 15 million dollars‘
‘In July 2015, profits peaked at around 29 million dollars‘
2. Sequencing
Of course if we want to talk about a long graph, we can’t just say:
‘Profits increased then profits leveled off then profits increased again then profits peaked then they fell’
If we want to join all the pieces together, we can’t use then every time. We need a few different connectors to make it more interesting, and to make it sound more professional. Here is a list of possible phrases:
-after that
-following that
-before + ____ing
‘profits fell to 1 million, before rising again during the second quarter’
– after + ____ing
‘After plummeting in early July, profits picked up later in the month’
-Since then
If the graph continues to the present time, it is possible to use since then for the last part:
‘Profits fell in March, but since then they have been slowly increasing again’
If we now take a look at a full graph, we can now give an accurate description of what you an see there, using the correct vocabulary, tenses, prepositions and sequencing:
To introduce the description of the graph, a good idea is to use the following options for phrases:
‘I would like to draw your attention to this graph of our profits over the last four years….’
‘If we take a look at this graph, we can see…’

…As you can see, profits took off in 2013 from 5 million to 15 million dollars. Following that, profits stabilized in 2014, before rising again in 2015. In July 2015, profits peaked at around 27 million, before plummeting to 6 million by the end of the year. Since then profits have been drying up during the first quarter of 2016…’
If you would like any further information about describing charts and graphs, or if you would like to see some more examples, feel free to email me at [email protected]! Check out more useful business grammar right here!

David Cox
Fluency Space
Make the world your fluency space. Business English for career and life success
Did you enjoy this article? Follow me on Linkedin!
[addthis tool=addthis_horizontal_follow_toolbox]
[button_4 border=”rounded” size=”large” color=”darkblue” align=”center” href=”https://fluencyspace.com/ebook/”]No time to improve your English? Check out my ‘5-step plan’ for busy professionals[/button_4]